Statistics for 2009–2022
National government pays out the money via the universities, but it is the regions that have to do the financial reporting. The financial report shall show how the funds have been allocated across premises costs, salary costs and other running costs. The report shall then form part of the universities’ annual reporting.
The payment is divided up into two parts: ALF payments for clinical research and ALF payments for educating physicians.

Where do the statistics come from?
The figures on this page are based on data from the table appendix “Redovisning av anslaget för klinisk utbildning och forskning” (“Report on the appropriation for clinical education and research”) in the Swedish National Agency for Higher Education’s and the Swedish Higher Education Authority’s annual reports for the budget years 2009–2022. As the data is taken from the universities’ annual reports, it is the names of these that are listed in the statistics.
The regions’ financial reports do not always tally to the last krona with what they have been allocated from national government; instead there is often a slight surplus or shortfall. The diagrams therefore show the ALF payments in two ways: amounts paid out and reported costs
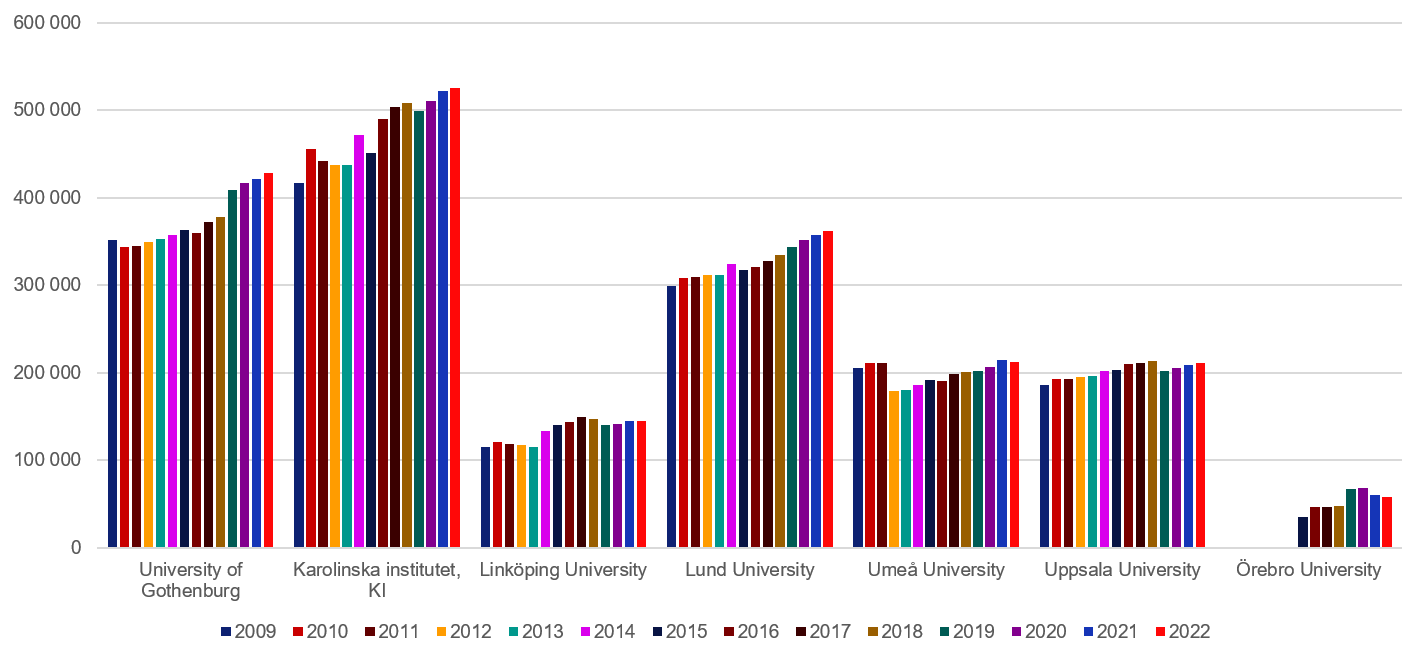
Amounts paid out for clinical research and education at doctoral level
Figures in thousands of kronor (KSEK).
Click on the figure to enlarge it.

* The reporting includes payments for odontological education and research. In 2021, the payment was 86.9 million SEK to the University of Gothenburg and 74.5 million SEK to Umeå University.
Amount paid out per HEI
Year | Amount |
|---|---|
2009 | 351 670 |
2010 | 344 033 |
2011 | 344 638 |
2012 | 349 742 |
2013 | 352 704 |
2014 | 357 841 |
2015 | 363 167 |
2016 | 359 765 |
2017 | 372 433 |
2018 | 378 441 |
2019 | 409 212 |
2020 | 417 048 |
2021 | 421 736 |
2022 | 428 708 |
Year | Amount |
|---|---|
2009 | 417 349 |
2010 | 455 826 |
2011 | 441 703 |
2012 | 437 470 |
2013 | 437 420 |
2014 | 471 937 |
2015 | 451 434 |
2016 | 489 536 |
2017 | 504 062 |
2018 | 508 337 |
2019 | 499 628 |
2020 | 510 734 |
2021 | 521 763 |
2022 | 525 831 |
Year | Amount |
|---|---|
2009 | 115 271 |
2010 | 120 388 |
2011 | 118 425 |
2012 | 117 112 |
2013 | 115 213 |
2014 | 133 806 |
2015 | 140 451 |
2016 | 143 699 |
2017 | 149 395 |
2018 | 147 308 |
2019 | 140 148 |
2020 | 141 485 |
2021 | 144 701 |
2022 | 144 601 |
* The reporting includes payments for odontological education and research. In 2021, the payment was 86.9 million SEK to the University of Gothenburg
Year | Amount |
|---|---|
2009 | 298 878 |
2010 | 308 661 |
2011 | 309 372 |
2012 | 311 692 |
2013 | 311 420 |
2014 | 324 011 |
2015 | 317 486 |
2016 | 320 544 |
2017 | 327 564 |
2018 | 334 414 |
2019 | 343 484 |
2020 | 351 274 |
2021 | 357 936 |
2022 | 362 433 |
Year | Amount |
|---|---|
2009 | 204 969 |
2010 | 211 072 |
2011 | 210 794 |
2012 | 179 148 |
2013 | 180 191 |
2014 | 186 194 |
2015 | 191 909 |
2016 | 190 961 |
2017 | 198 344 |
2018 | 200 633 |
2019 | 201 670 |
2020 | 206 429 |
2021 | 213 980 |
2022 | 212 135 |
Year | Amount |
|---|---|
2009 | 185 671 |
2010 | 192 788 |
2011 | 193 262 |
2012 | 194 970 |
2013 | 196 081 |
2014 | 201 696 |
2015 | 203 112 |
2016 | 209 600 |
2017 | 210 714 |
2018 | 213 900 |
2019 | 202 074 |
2020 | 205 476 |
2021 | 209 020 |
2022 | 211 222 |
* The reporting includes payments for odontological education and research. In 2021, the payment was 74.5 million SEK to Umeå University.
Year | Amount |
|---|---|
2015 | 35 000 |
2016 | 46 396 |
2017 | 46 680 |
2018 | 47 984 |
2019 | 67 073 |
2020 | 68 358 |
2021 | 60258 |
2022 | 58 243 |
The current ALF agreement came into force as from 2015. In conjunction with this, Region Örebro was included in the agreement, an has therefore only received ALF payments since 2015.
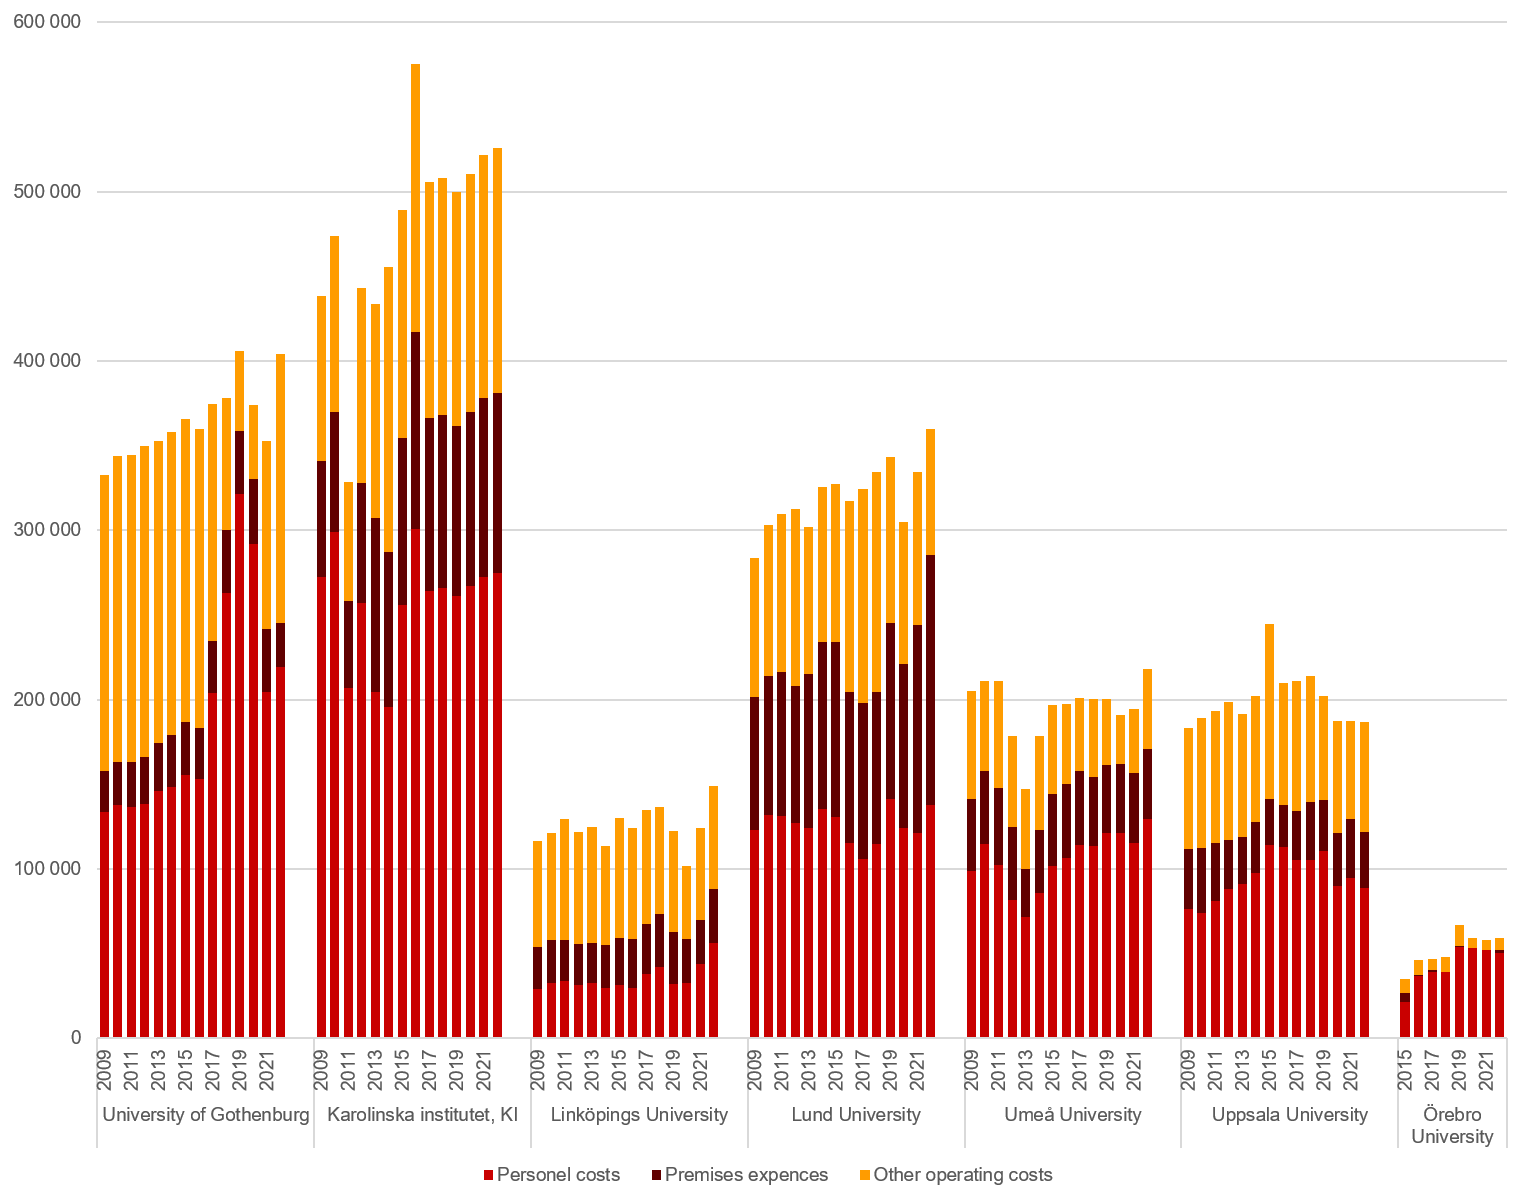
Reported costs for clinical research and education at doctoral level
Figures in thousands of kronor (KSEK).
Click on the figure to enlarge it.

* The reporting includes payments for odontological education and research. In 2021, the payment was 86.9 million SEK to the University of Gothenburg and 74.5 million SEK to Umeå University.

Where do the statistics come from?
The figures on this page are based on data from the table appendix “Redovisning av anslaget för klinisk utbildning och forskning” (“Report on the appropriation for clinical education and research”) in the Swedish National Agency for Higher Education’s and the Swedish Higher Education Authority’s annual reports for the budget years 2009–2022. As the data is taken from the universities’ annual reports, it is the names of these that are listed in the statistics.
The regions’ financial reports do not always tally to the last krona with what they have been allocated from national government; instead there is often a slight surplus or shortfall. The diagrams therefore show the ALF payments in two ways: amounts paid out and reported costs.
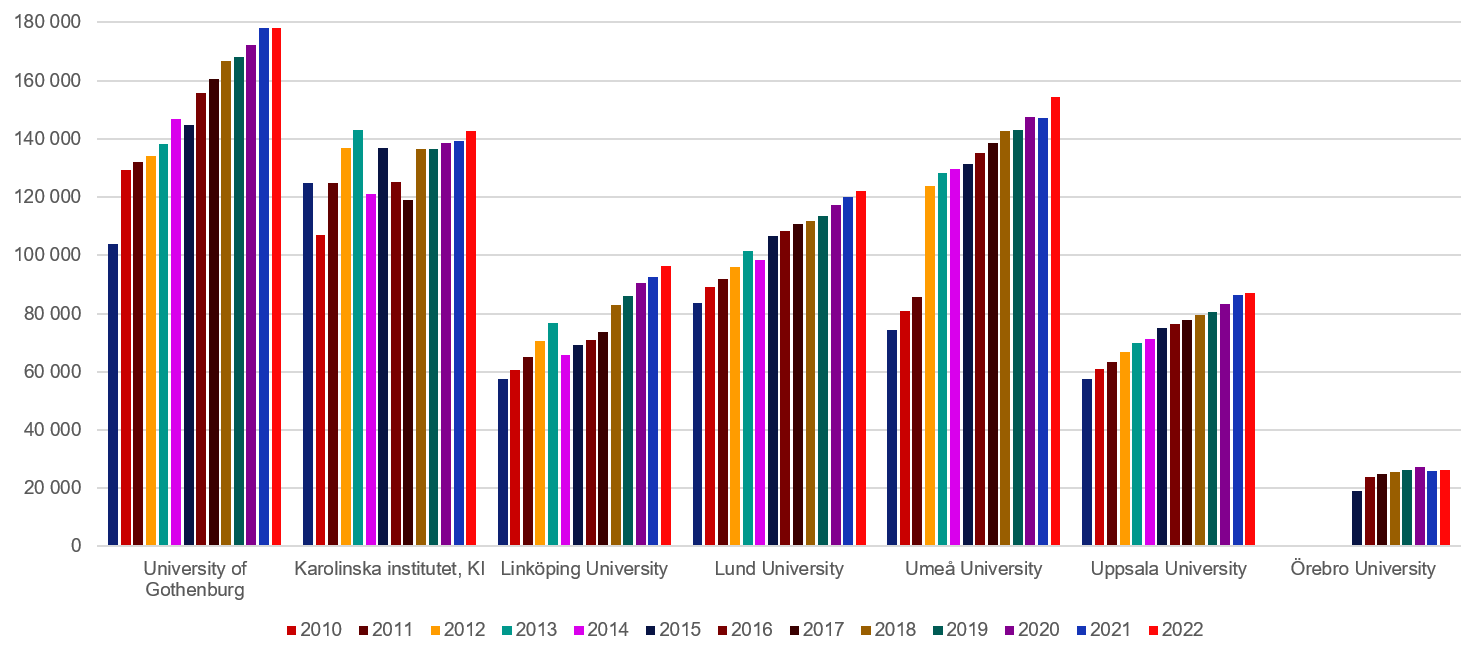
Amount paid out for education of physicians
Figures in thousands of kronor (KSEK).

* The reporting includes payments for odontological education and research. In 2021, the payment was 86.9 million SEK to the University of Gothenburg and 74.5 million SEK to Umeå University.
Amount paid out per HEI
Year | Amount |
|---|---|
2009 | 103 892 |
2010 | 129 185 |
2011 | 132 127 |
2012 | 134 222 |
2013 | 138 234 |
2014 | 146 875 |
2015 | 144 781 |
2016 | 155 607 |
2017 | 160 682 |
2018 | 166 645 |
2019 | 168 167 |
2020 | 172 168 |
2021 | 178 273 |
2022 | 178 270 |
Year | Amount |
|---|---|
2009 | 124 830 |
2010 | 106 922 |
2011 | 124 850 |
2012 | 136 930 |
2013 | 142 958 |
2014 | 120 976 |
2015 | 136 920 |
2016 | 125 083 |
2017 | 119 081 |
2018 | 136 580 |
2019 | 136 675 |
2020 | 138 535 |
2021 | 139 334 |
2022 | 142 878 |
Year | Amount |
|---|---|
2009 | 57 636 |
2010 | 60 559 |
2011 | 65 212 |
2012 | 70 684 |
2013 | 76 809 |
2014 | 65 905 |
2015 | 69 178 |
2016 | 70 777 |
2017 | 73 583 |
2018 | 82 861 |
2019 | 85 897 |
2020 | 90 458 |
2021 | 92 513 |
2022 | 96 401 |
* The reporting includes payments for odontological education and research. In 2021, the payment was 86.9 million SEK to the University of Gothenburg.
Year | Amount |
|---|---|
2009 | 83 772 |
2010 | 89 201 |
2011 | 91 852 |
2012 | 95 961 |
2013 | 101 466 |
2014 | 98 465 |
2015 | 106 525 |
2016 | 108 241 |
2017 | 110 782 |
2018 | 111 850 |
2019 | 113 403 |
2020 | 117 204 |
2021 | 119 985 |
2022 | 122 170 |
Year | Amount |
|---|---|
2009 | 74 181 |
2010 | 80 990 |
2011 | 85 542 |
2012 | 123 832 |
2013 | 128 145 |
2014 | 129 796 |
2015 | 131 531 |
2016 | 135 029 |
2017 | 138 740 |
2018 | 142 733 |
2019 | 143 145 |
2020 | 147 453 |
2021 | 147 221 |
2022 | 154 322 |
Year | Amount |
|---|---|
2009 | 57 345 |
2010 | 60 809 |
2011 | 63 394 |
2012 | 66 707 |
2013 | 69 748 |
2014 | 71 185 |
2015 | 74 869 |
2016 | 76 324 |
2017 | 77 935 |
2018 | 79 608 |
2019 | 80 643 |
2020 | 83 440 |
2021 | 86 349 |
2022 | 87 059 |
* The reporting includes payments for odontological education and research. In 2021, the payment was 74.5 million SEK to Umeå University.
Year | Amount |
|---|---|
2015 | 18 880 |
2016 | 23 975 |
2017 | 24 787 |
2018 | 25 470 |
2019 | 26 124 |
2020 | 27 213 |
2021 | 26 015 |
2022 | 26 355 |
The current ALF agreement came into force as from 2015. In conjunction with this, Region Örebro was included in the agreement, an has therefore only received ALF payments since 2015.
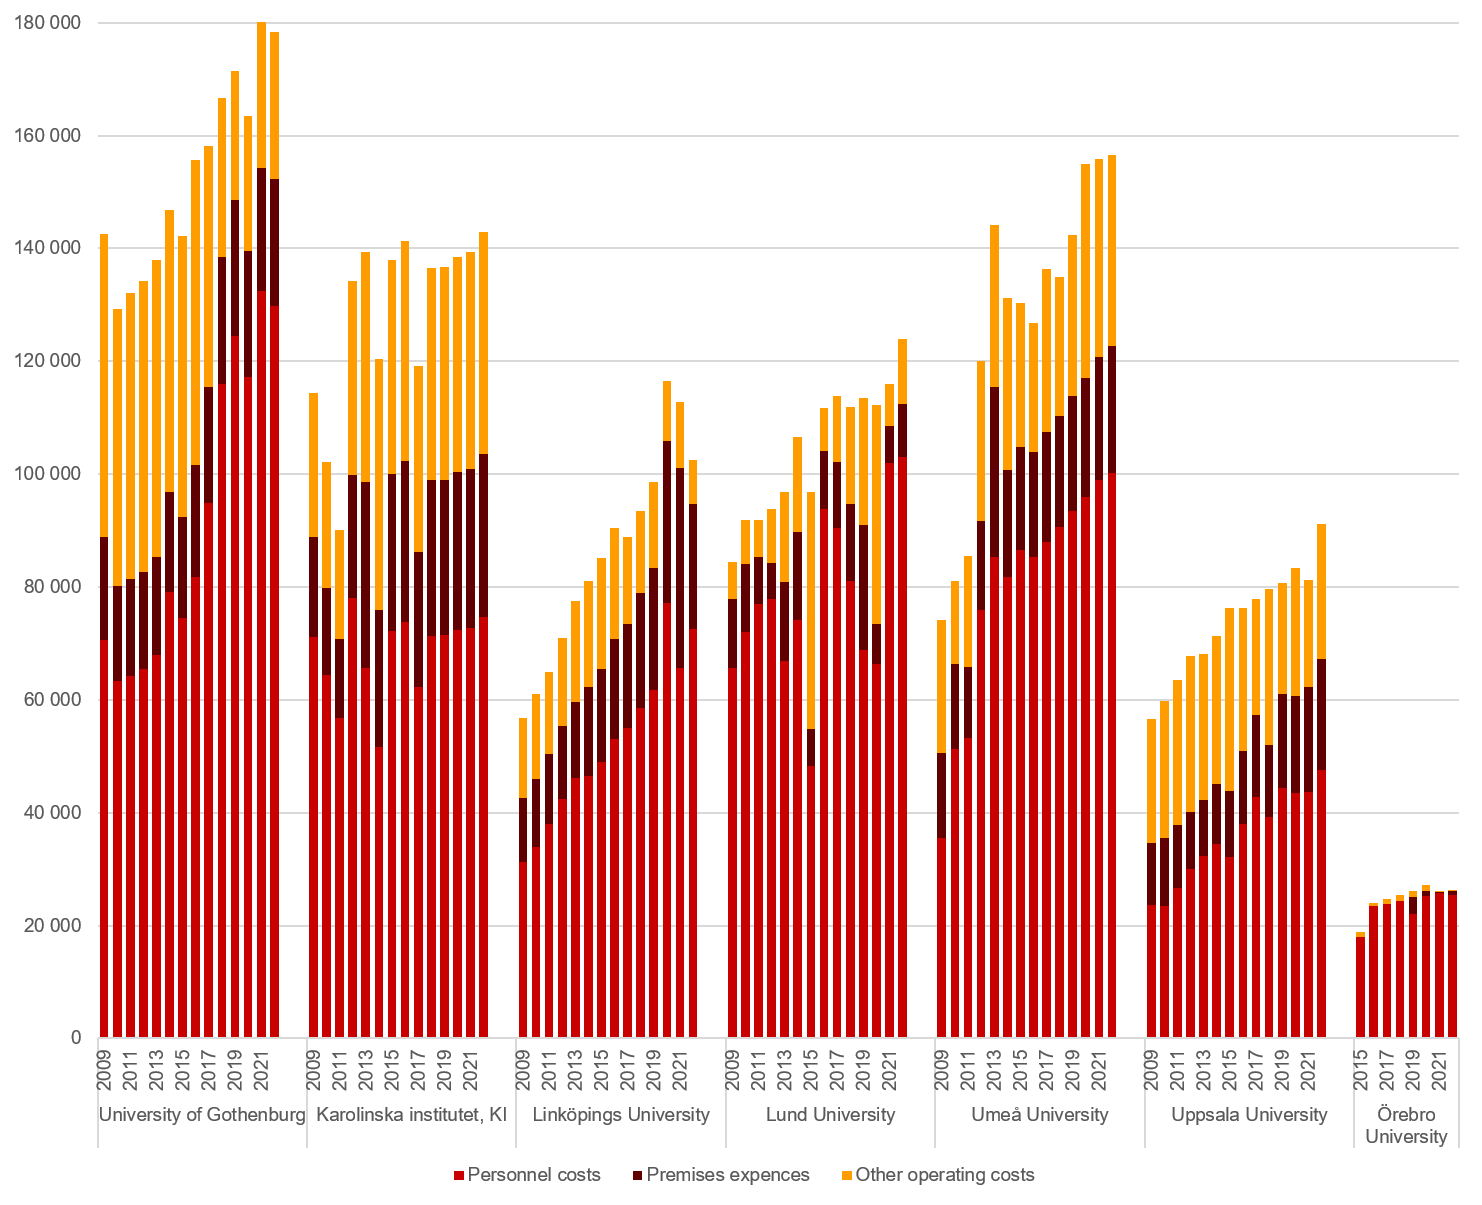
Reported costs for education of physicians
Figures in thousands of kronor (KSEK)
Click on the figure to enlarge it.
The regions allocate the payments in different ways
The ALF agreement is supplemented with regional agreements between the universities and regions, regulating items such as prioritisation and allocation of the ALF payments. This means that each region prioritises and allocates the funds in slightly different ways.
In principle, it could be said that there are two main tracks that are used wholly or in part when allocating ALF funds. One is allocation according to applications for funds from individual researchers or research teams, the other is allocation according to key figures based on various key measures of research quality, such as number of publications, doctoral degree awards and docentships. Furthermore, the regions have differing strategies for how the ALF payment is allocated to premises costs, salary costs and other running costs.
PublISHED ON
UpDATED ON


